Research Areas & Select Publications
-
While the Poisson distribution is a popular distribution for modeling count data, it is constrained
by the "equi-dispersion assumption" (i.e. that the variance equals the mean). Real data oftentimes do not adhere to this
restriction in that the data are found to be either over- or under-dispersed. The Conway-Maxwell-Poisson (COM-Poisson)
distribution is a flexible, two-parameter alternative that not only generalizes the Poisson distribution, but also
captures the Bernoulli and geometric distributions as special case distributions. Various works center around the development
of related distributions and statistical methods that are motivated by the COM-Poisson distribution.
Bivariate Conway-Maxwell-Poisson distribution: Formulation, properties, and inference
Sellers et al. (2016)
A Generalized Statistical Control Chart for Over- or Under-Dispersed Data
Sellers (2012)
-
Researchers can analyze their dispersed count data via various R packages available on the Comprehensive R Archive Network (CRAN). Several R packages have been developed to perform count data modeling via the Conway-Maxwell-Poisson (CMP) distribution, including regression analysis, count processes, bivariate modeling, and control chart theory.
multicmp: Flexible Modeling of Multivariate Count Data via the Multivariate Conway-Maxwell-Poisson Distribution (Version 1.0)
Sellers et al. (2017)
-

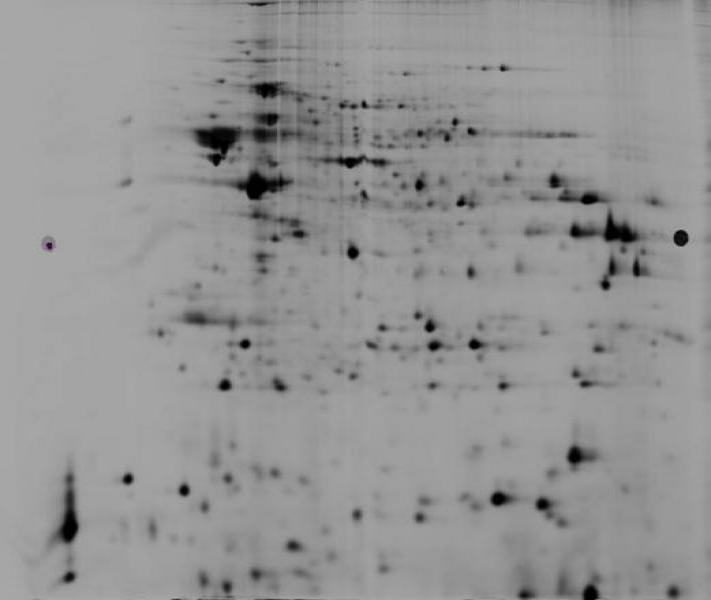
Proteomic data analysis describes the collaborative study of protein change via differential expression and
modification. Two-dimensional gel electrophoresis methods separate the proteins by pH and molecular weight to better
study protein change on a large scale. Statistical methods provide scientists with the ability to quantitatively study
these proteins and detect statistically significant protein change through two-dimensional polyacrylamide gel
electroresis (2D-PAGE) and two-dimensional difference gel electrophoresis (2D-DIGE) images, where the proteins appear as
spots in the images. The number and size of the images are a nice "Big Data" example.
A comparison of imputation procedures and statistical tests for the analysis of two-dimensional electrophoresis data
Miecznikowski et al. (2010)
Lights, Camera, Action! Systematic variation in 2-D difference gel electrophoresis images
Sellers et al. (2007)
Race matters: analyzing the relationship between colorectal cancer mortality rates and various factors within respective racial groups
Veach et al. (2014)
Kimberly F. Sellers306 St. Mary's Hall37th and O Streets, NW; Washington, DC 20057Phone: 202-687-8829Fax: 202-687-6067kfs7@georgetown.edu
